Kearney Public Schools Data Visualization
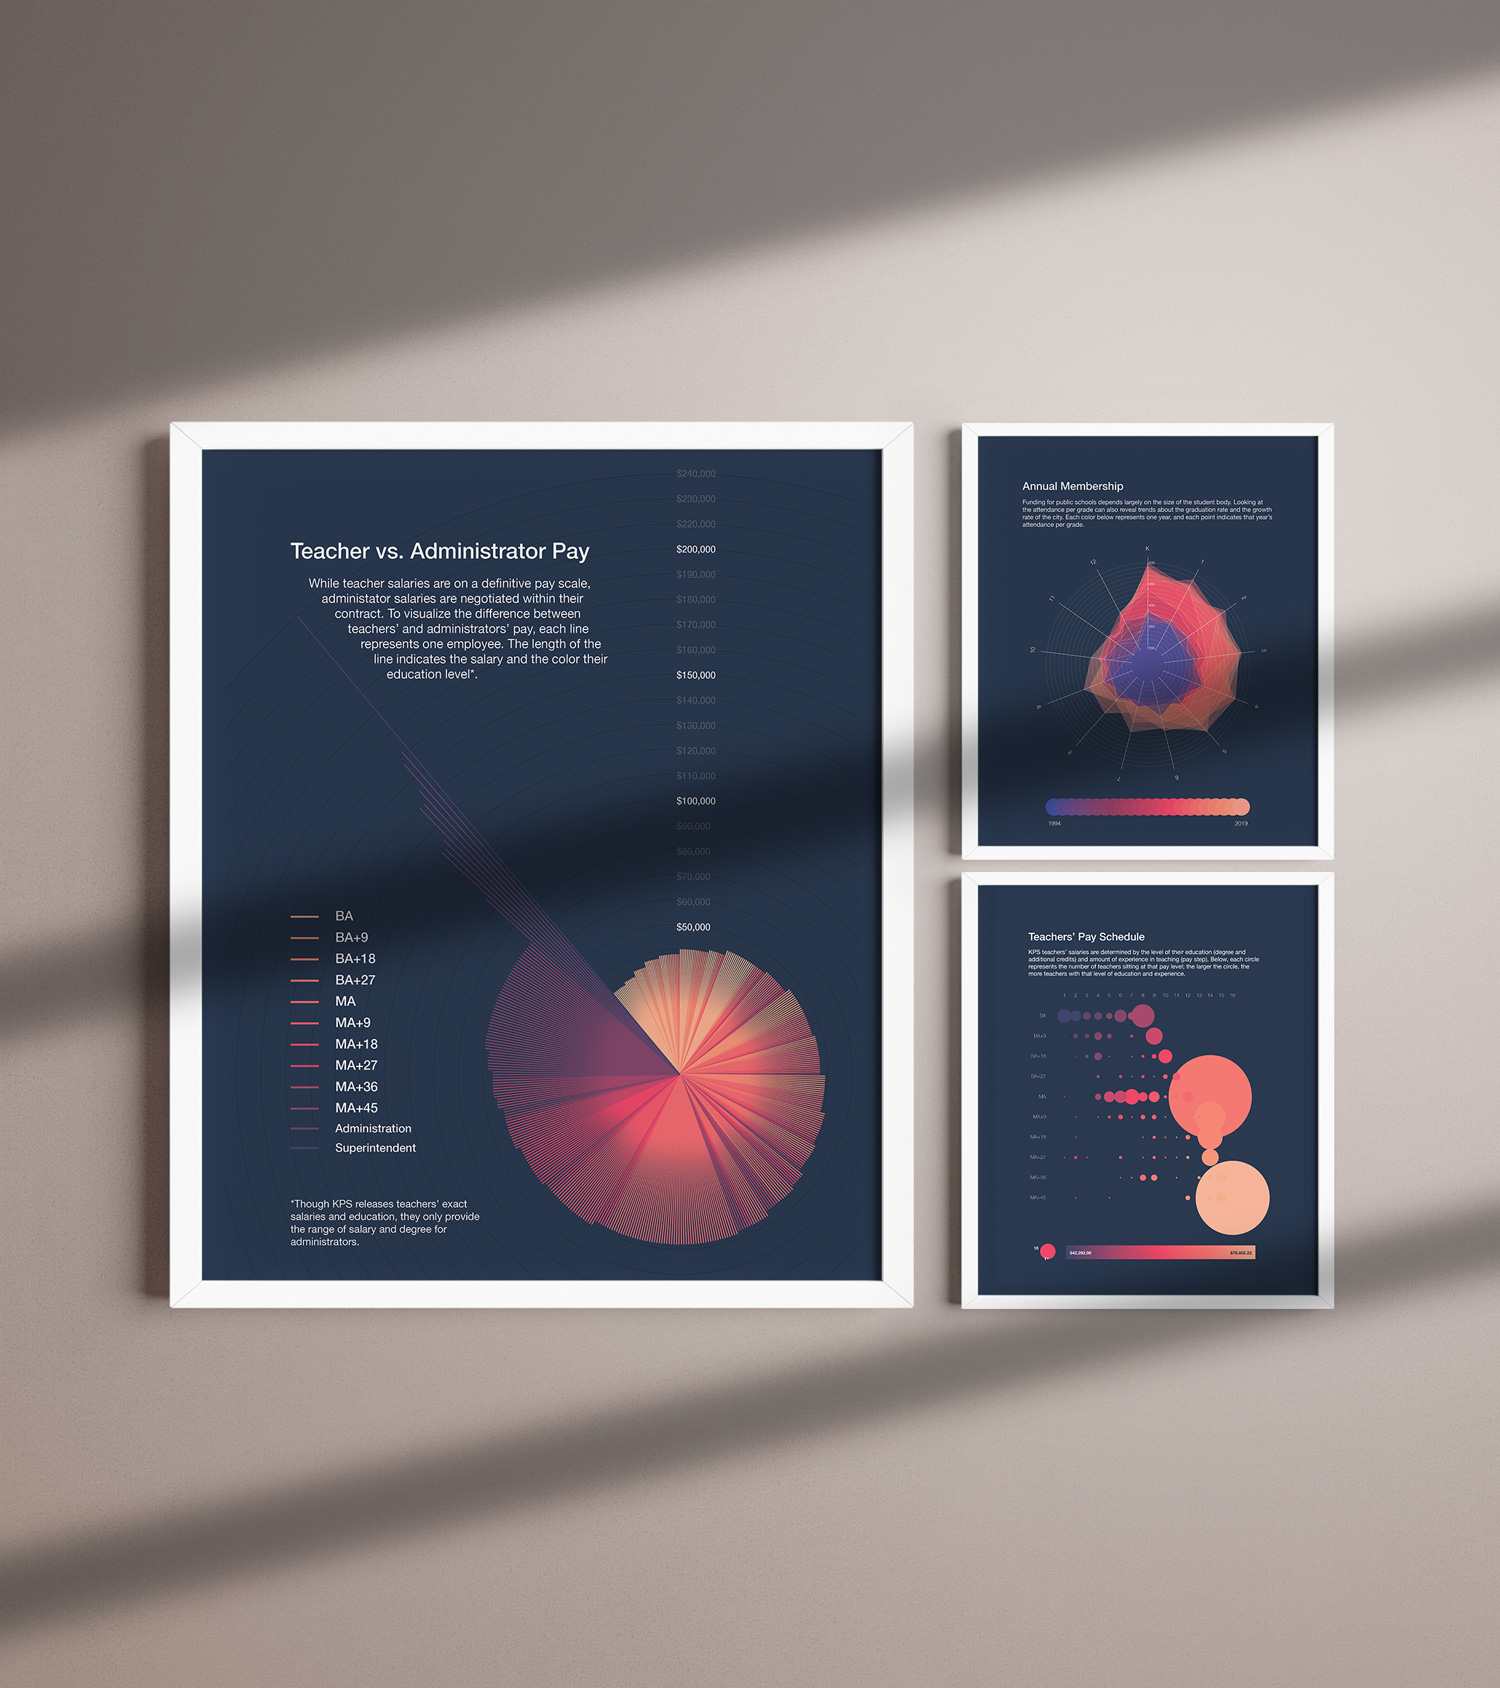
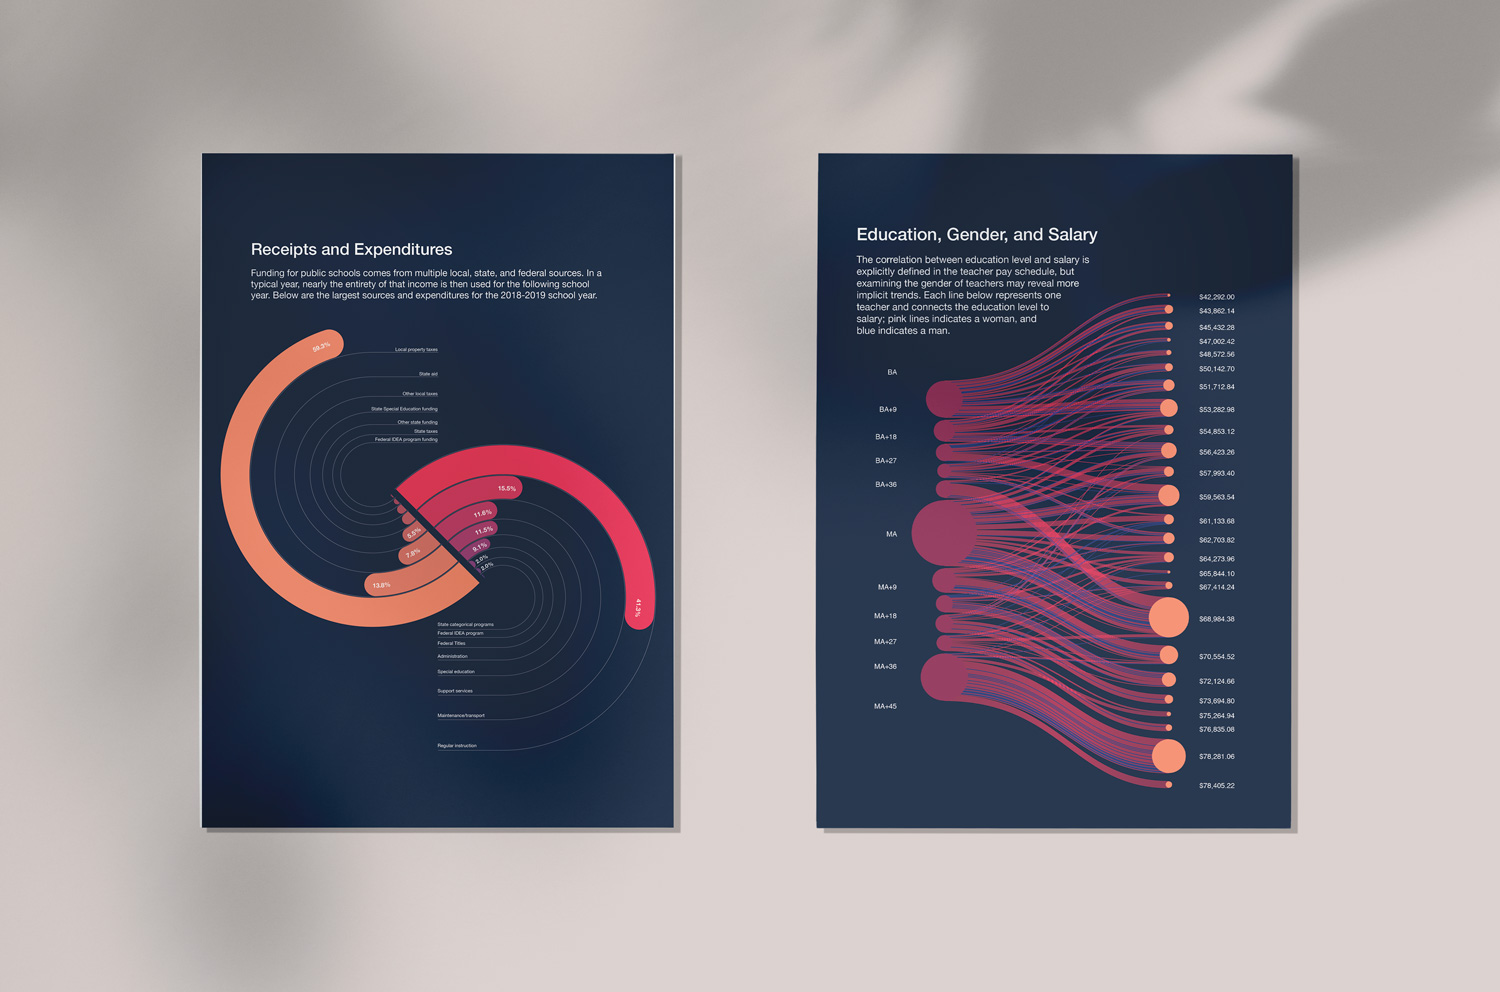
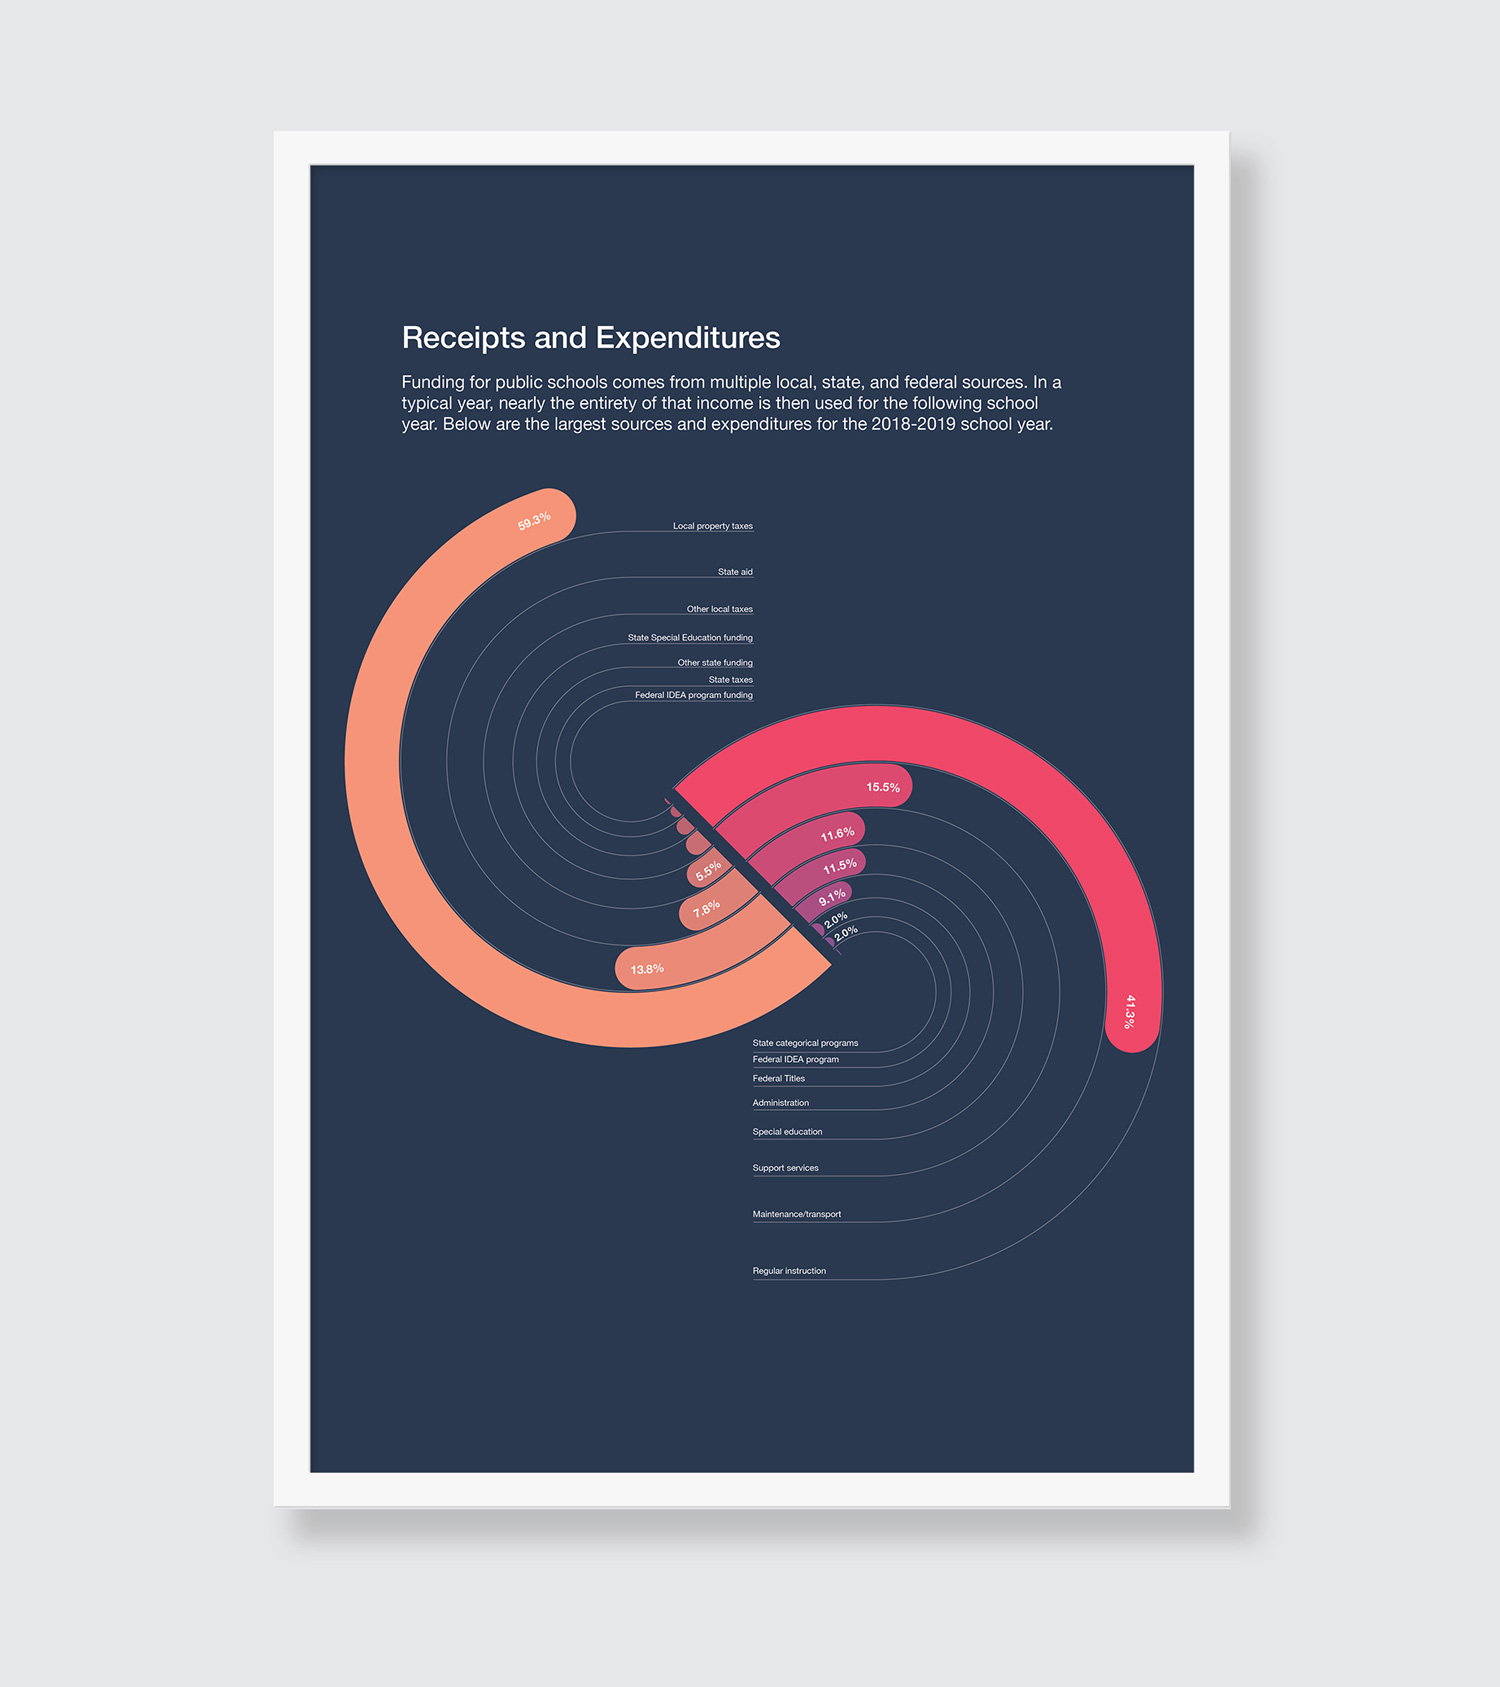
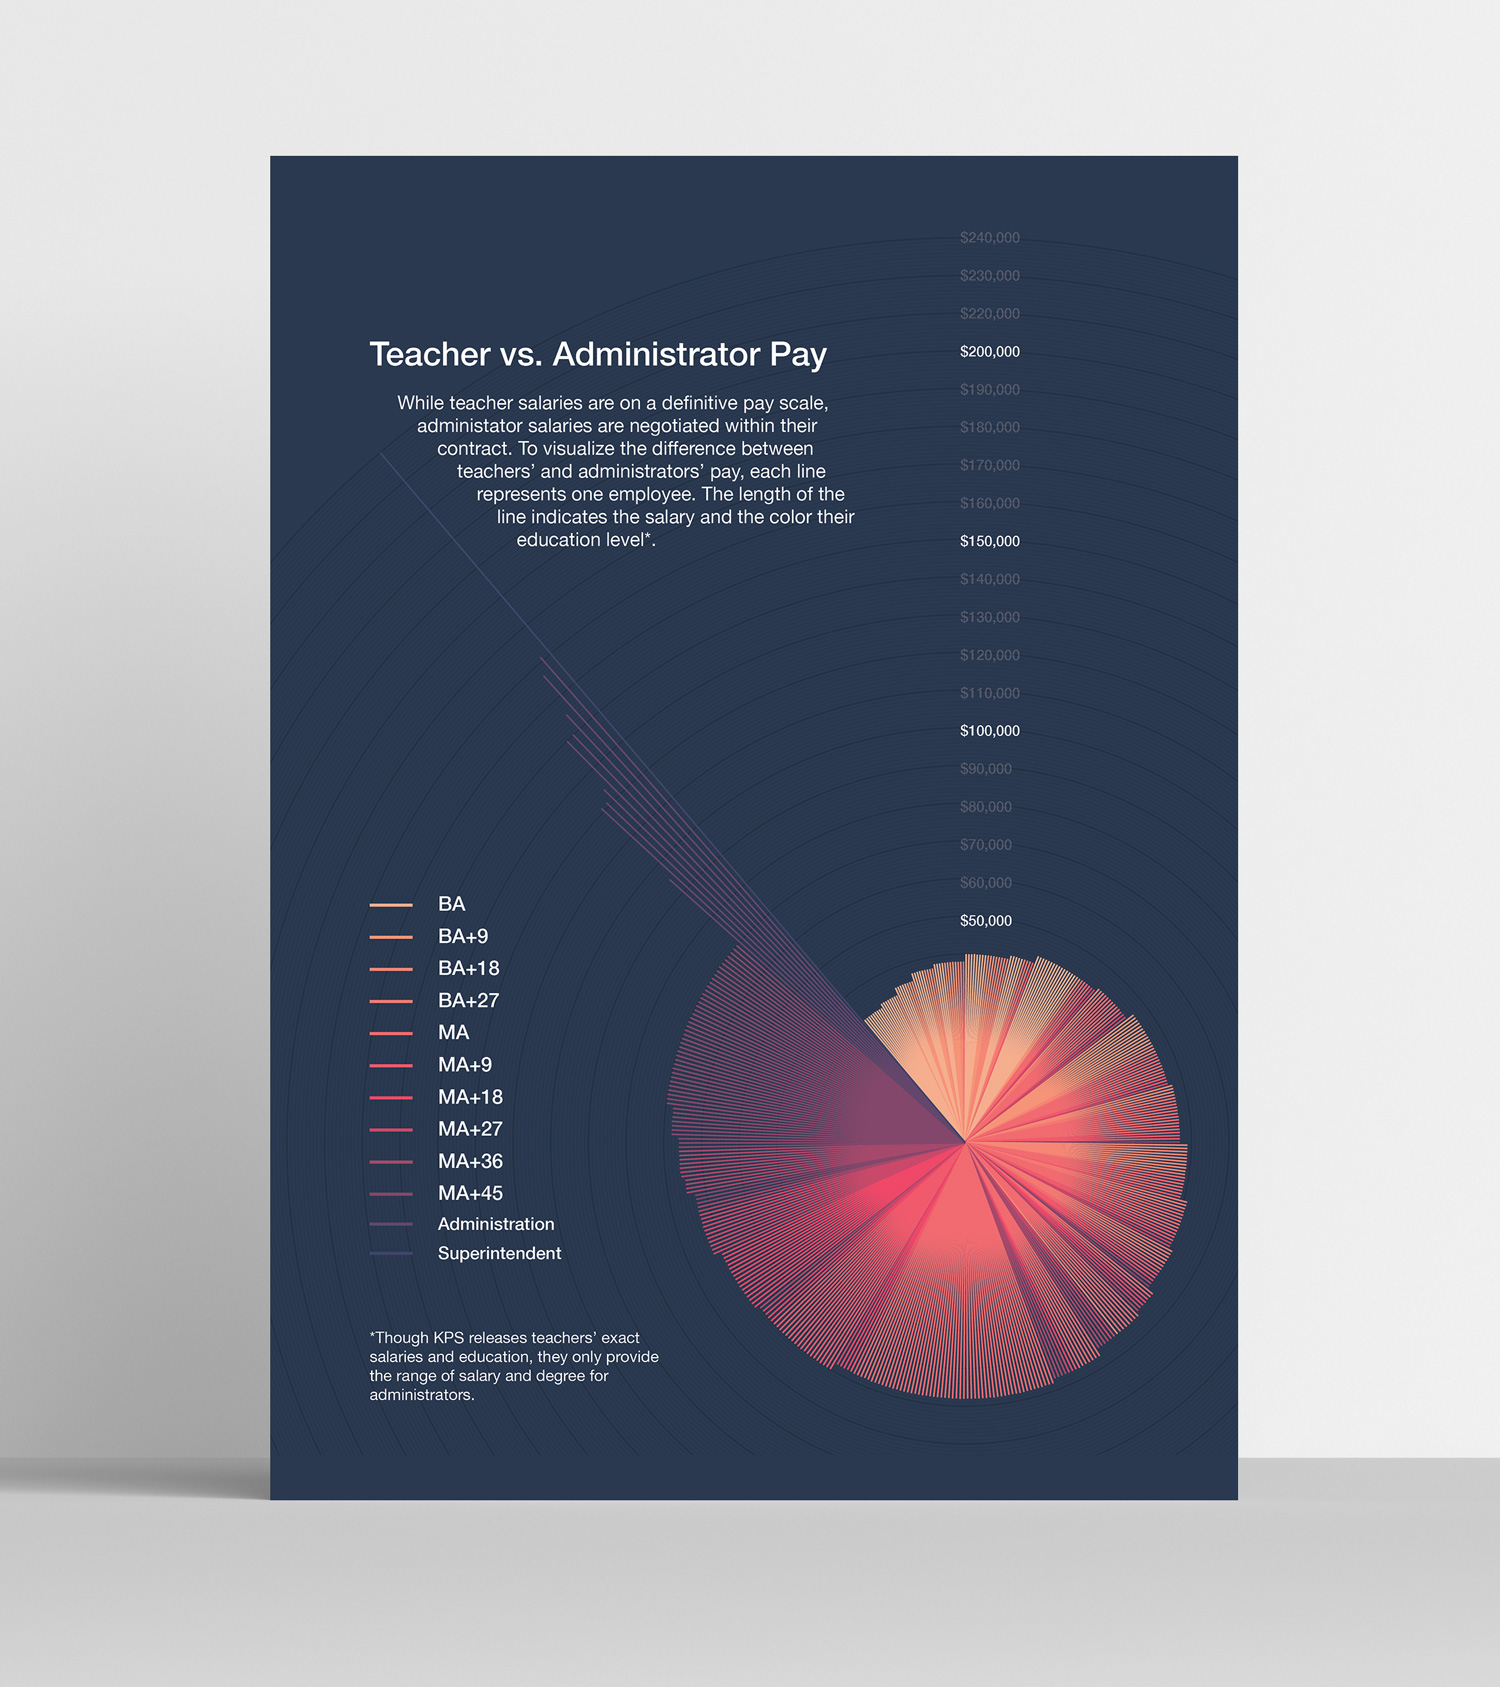
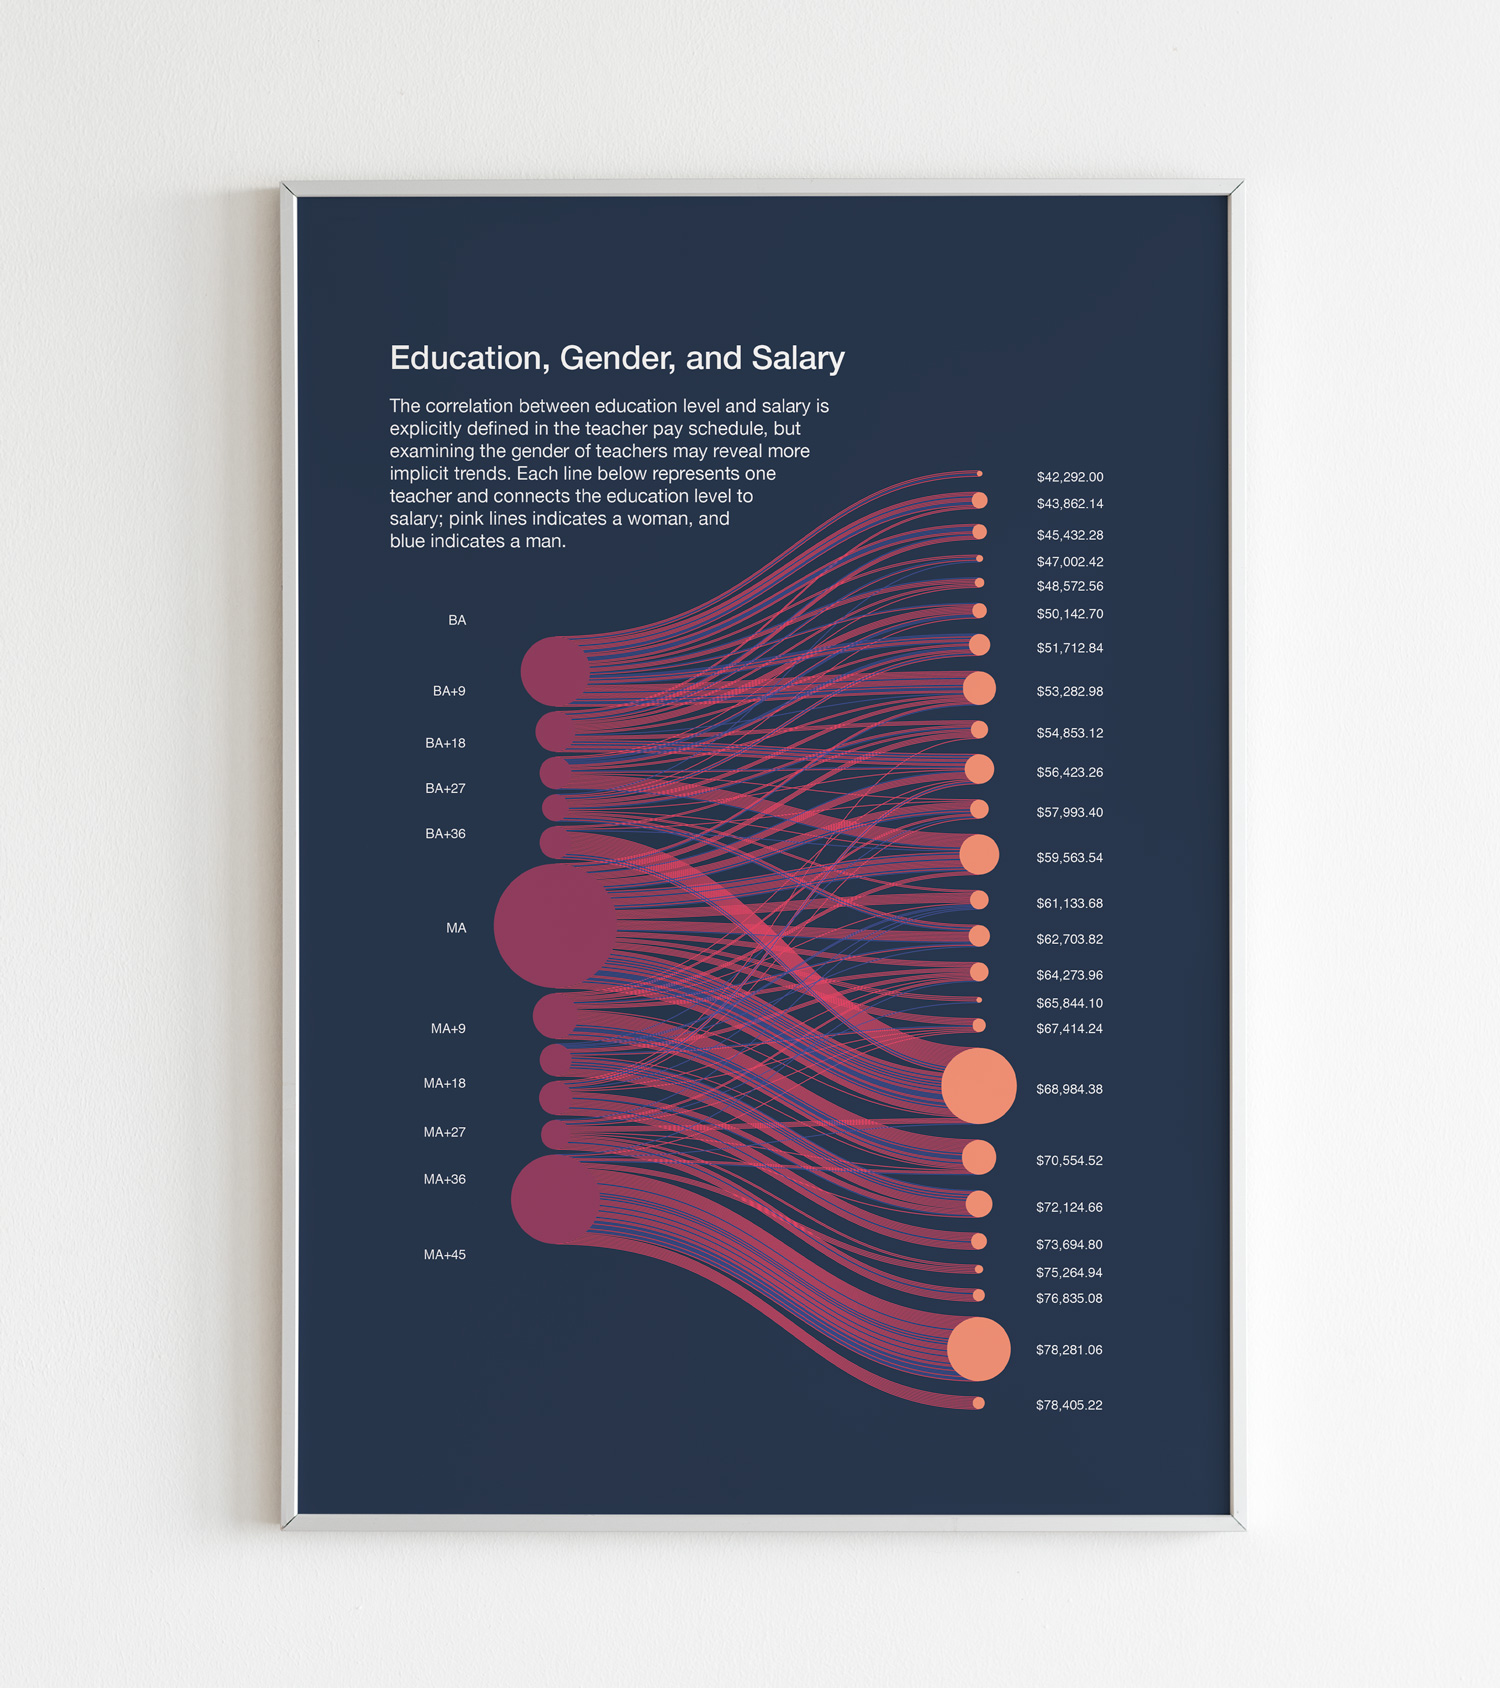
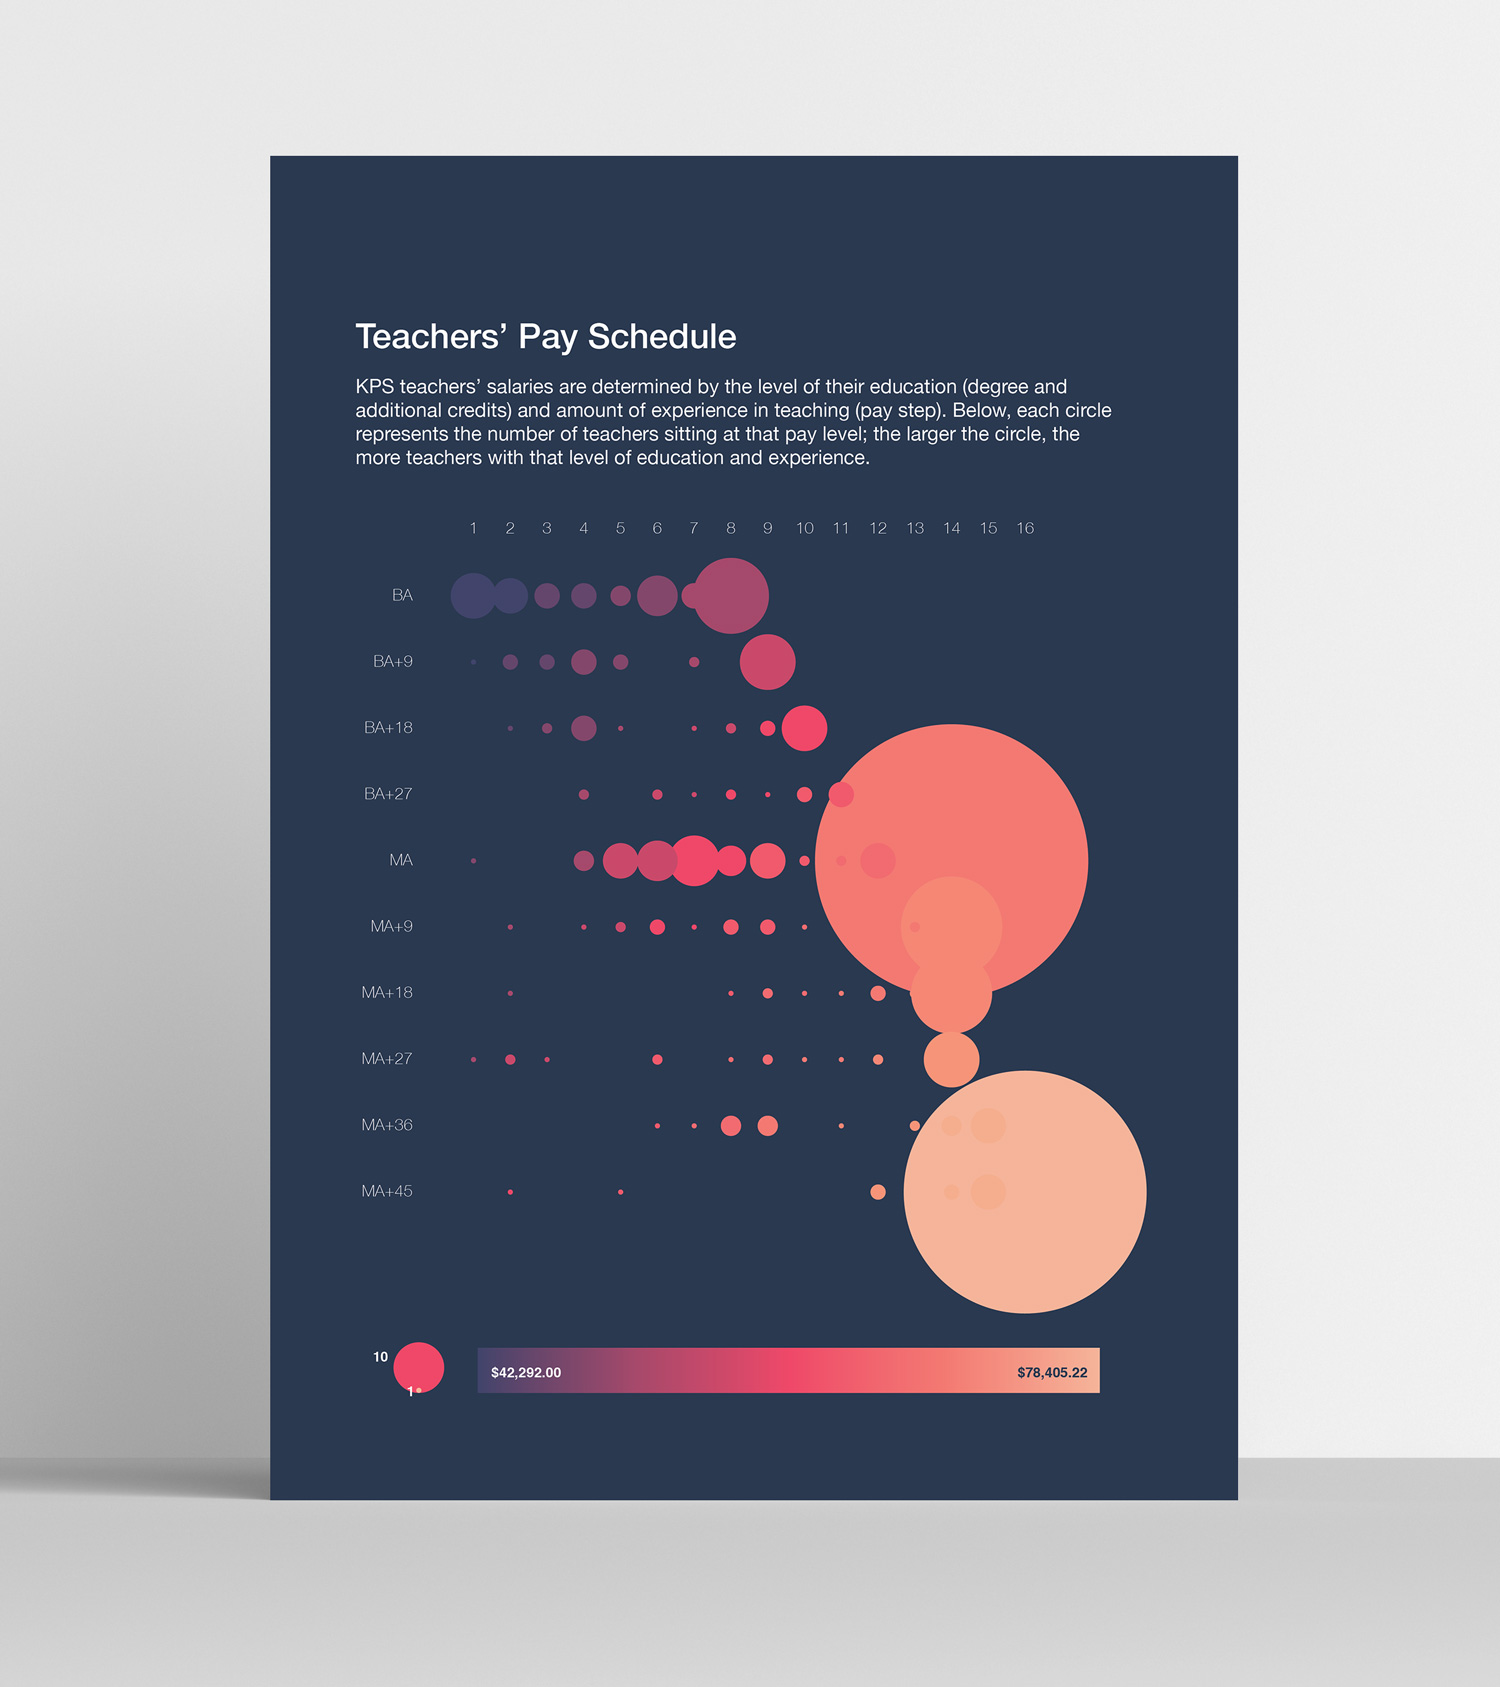
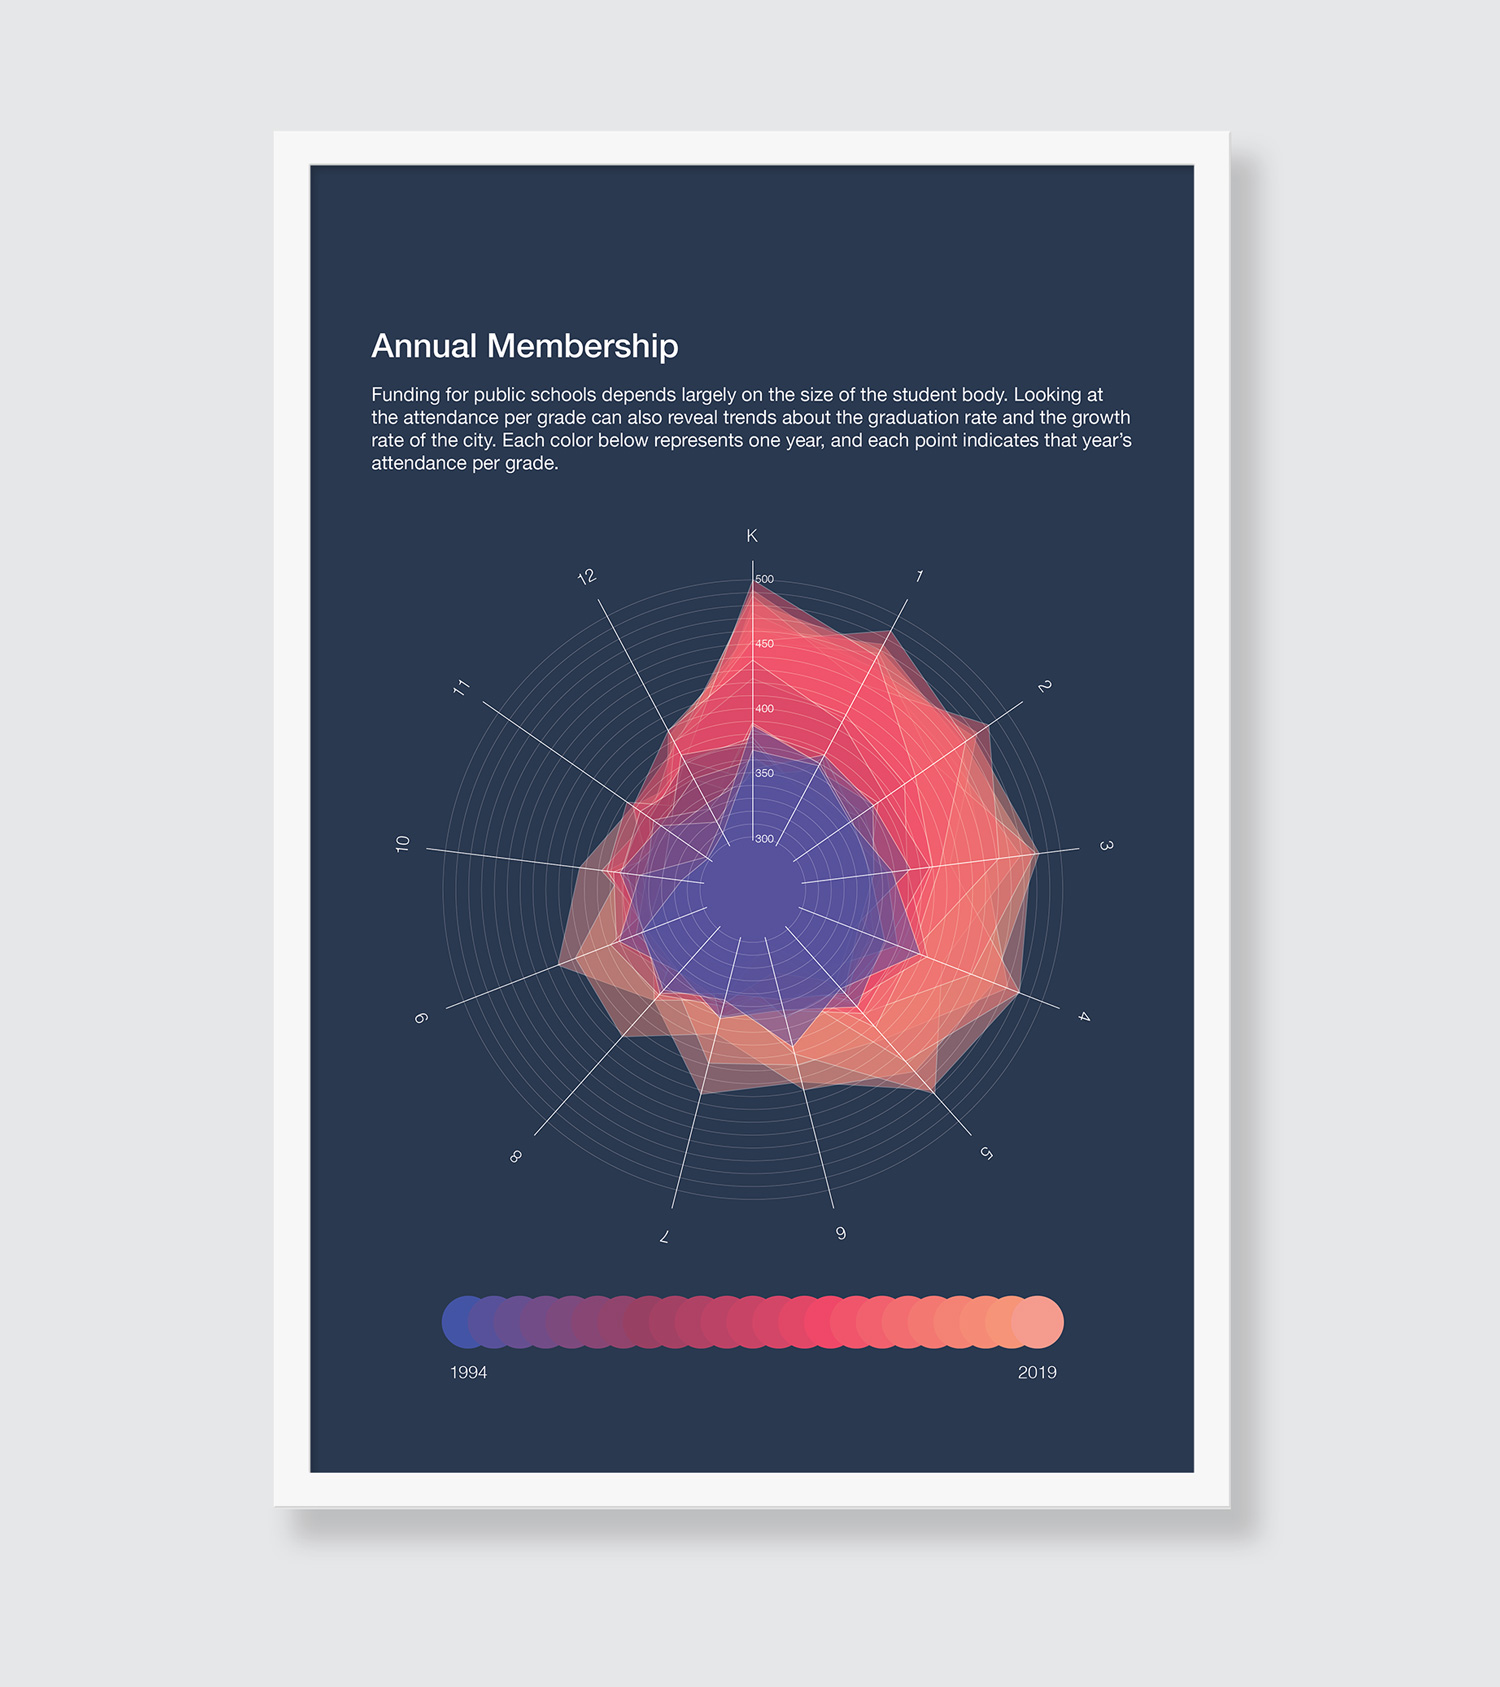
These data visualizations aim to create an easily understandable visual from the plethora of budget spreadsheets provided to the public. Using the data from the 2018-2019 school year for Kearney Public Schools in Nebraska, these graphs focus on: income and expenditures; teacher vs. administrator pay; education, gender, and salary; teacher pay schedule; and annual membership. Taken all together, they paint a picture of the district’s priorities, obligations, and predictions for the future.
Task
Convert the raw data provided by KPS to pleasing and understandable visuals
-
Date
September 1, 2019
-
Skills
Data interpretation, Excel
